6.1 Areas Between Curves/10: Difference between revisions
Jump to navigation
Jump to search
No edit summary |
No edit summary |
||
| Line 1: | Line 1: | ||
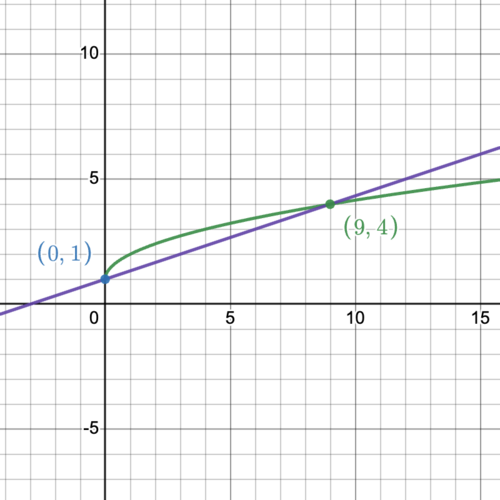
[[File:Desmos-graphs.png|right|500px|]] | [[File:Desmos-graphs.png|right|500px|]] | ||
<math> | |||
\begin{align} | |||
& \color{red}\mathbf{y=1+\sqrt{x}} | |||
& \color{royalblue}\mathbf{y=\frac{3+x}{3}} \\ | |||
\\ | |||
\end{align} | |||
</math> | |||
Revision as of 04:19, 20 September 2022

